|
SITE MAP
STEWARDSHIP
UNION
PROJECT
EARTH AS IT IS
POLICIES
RESEARCH
ESSAYS
|
O.T. FORD | CARTOGRAPHY
Below are examples of maps produced for various reasons illustrations of my own research, but also assignments and commissions. There are additional maps in the reference base, which I also produced. The thumbnails below link to PDFs at higher resolution; certain features, such as text, may only be visible in the PDFs. As is always the case in cartography, there may be general principles, but each map is meant to serve specific purposes, determined by the subject, the data, the audience and, as may be, the commissioning party.
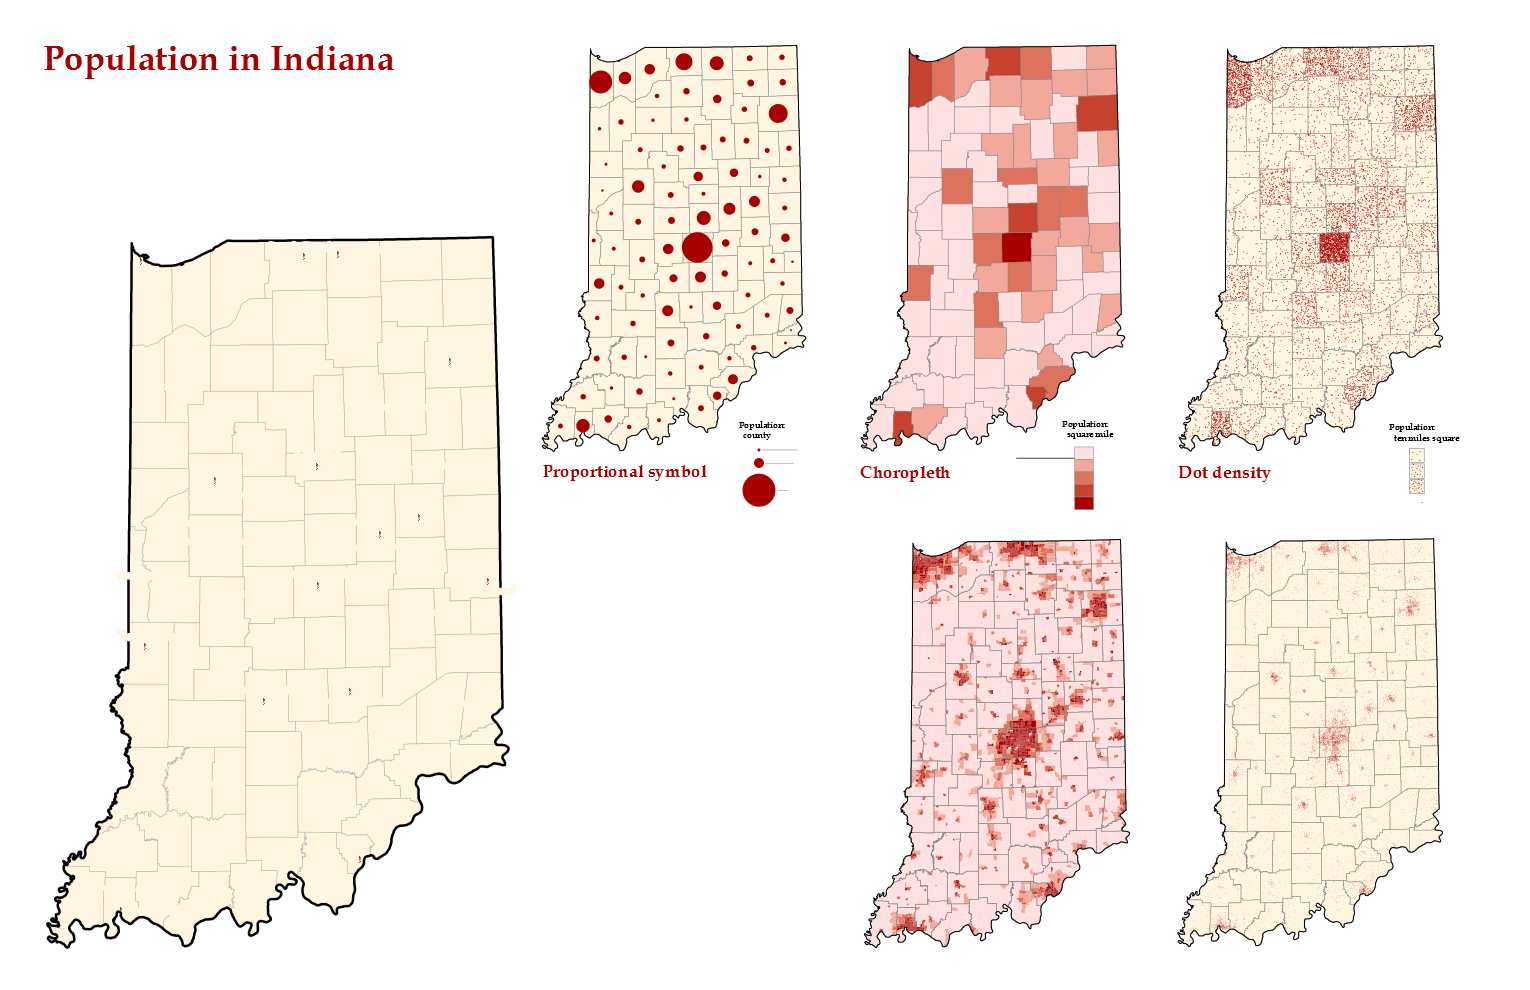
Population study: Indiana
An exercise comparing various methods of depicting population distribution and density: proportional symbols, choropleths, and dot density. For the last two, the contrast between different spatial resolutions was also illustrated.
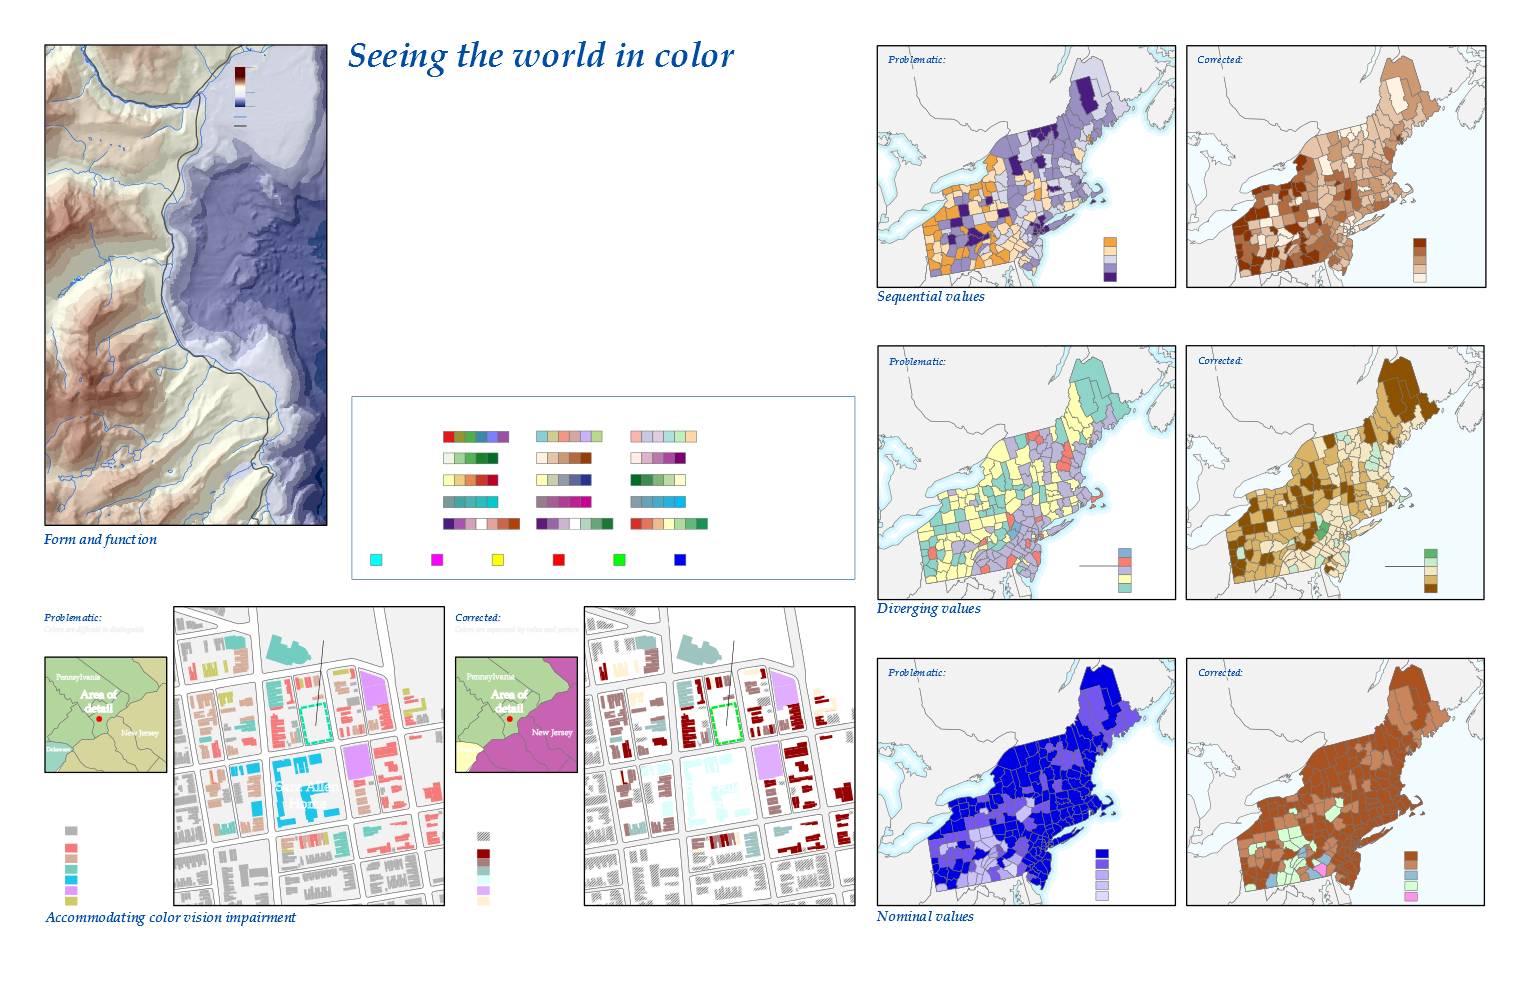
Color study: what works and what doesnt
An exercise in color and shade selection and contrast. The assignment was to illustrate cartographic principles involving the use of color with specific data sets.
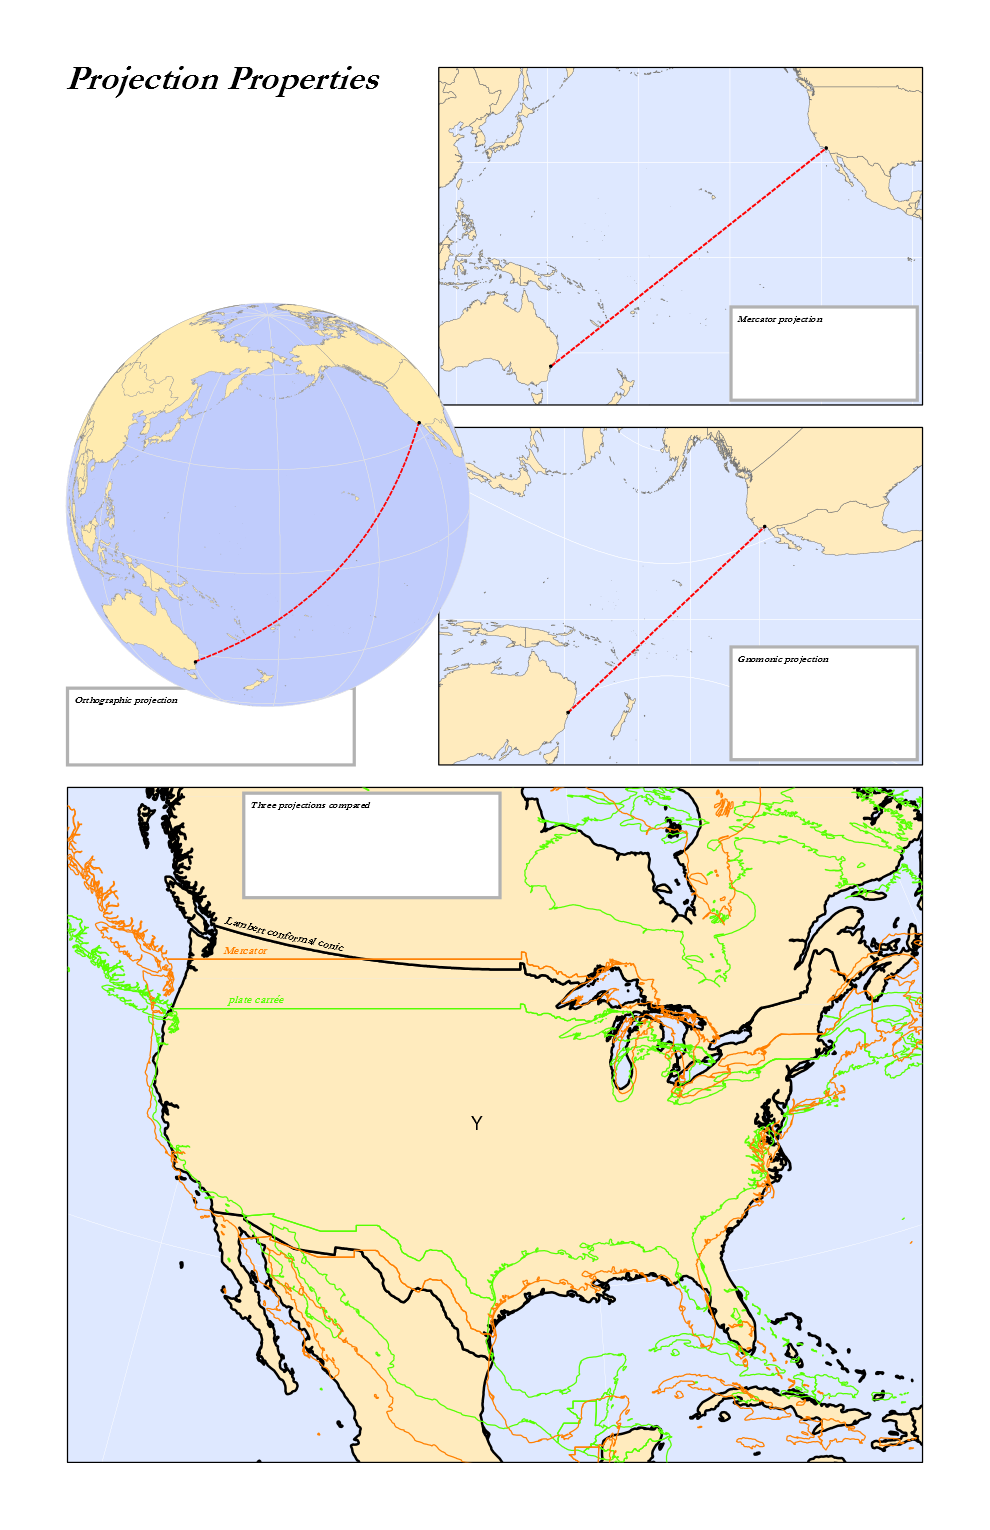
Projection study
An exercise to demonstrate the various ways the choice of map projection can affect the appearance of geographic data.
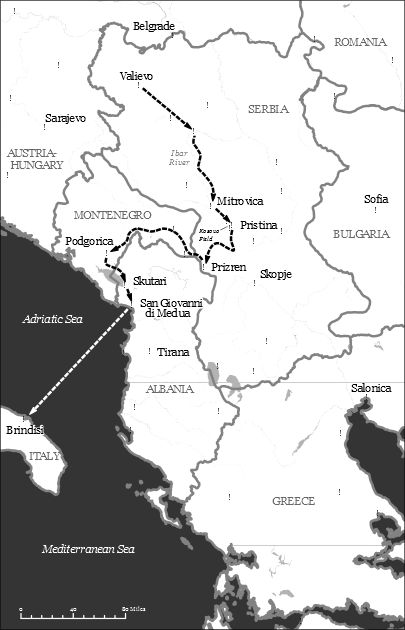
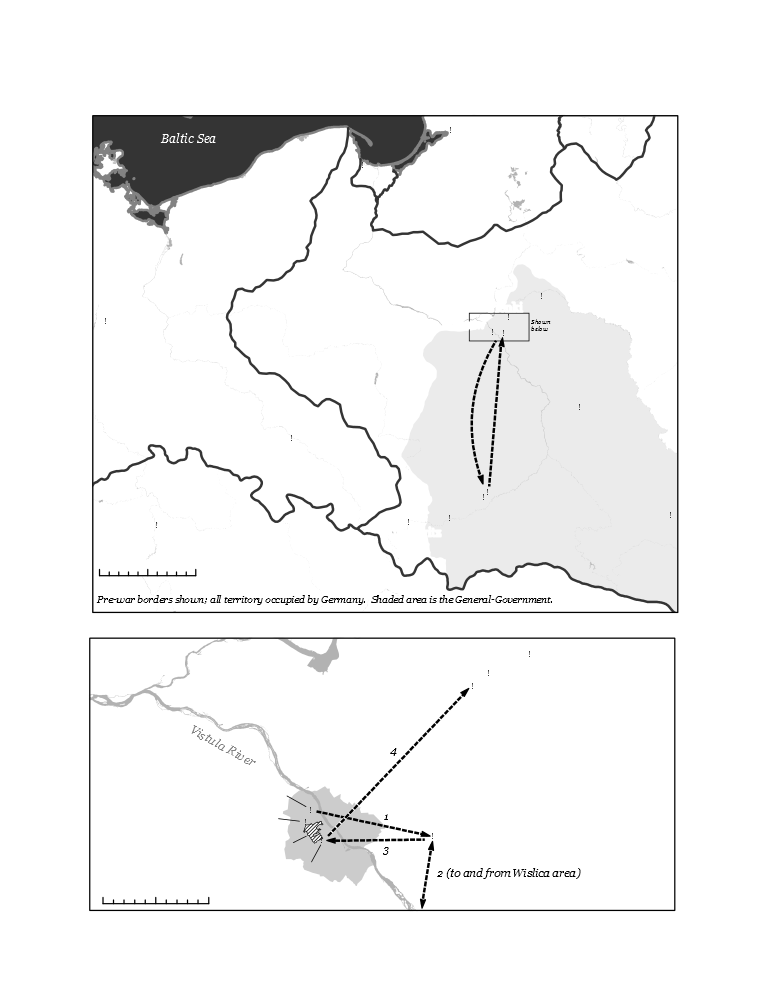
Hirszfelds retreat from Serbia, 1915
A commission for Ludwik Hirszfeld, The story of one life (Marta A. Balińska and William H. Schneider, eds.), University of Rochester, 2010. The editors wanted an illustration of the authors movements during two time periods (see also below). Each needed to be of fixed dimensions (to match the book), with requests for the inclusion of specific surrounding features, sometimes taken from the authors story (e.g., Salonica and Berlin).
Hirszfelds escape from the Warsaw Ghetto, 1943-1944
A commission for Ludwik Hirszfeld, The story of one life (Marta A. Balińska and William H. Schneider, eds.), University of Rochester, 2010, under the guidelines described above.
|
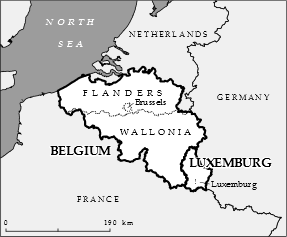
Belgium and Luxemburg
A commission for a study of currency harmonization. The author wanted a simple map of the two states being studied, which shared a currency long before the euro.
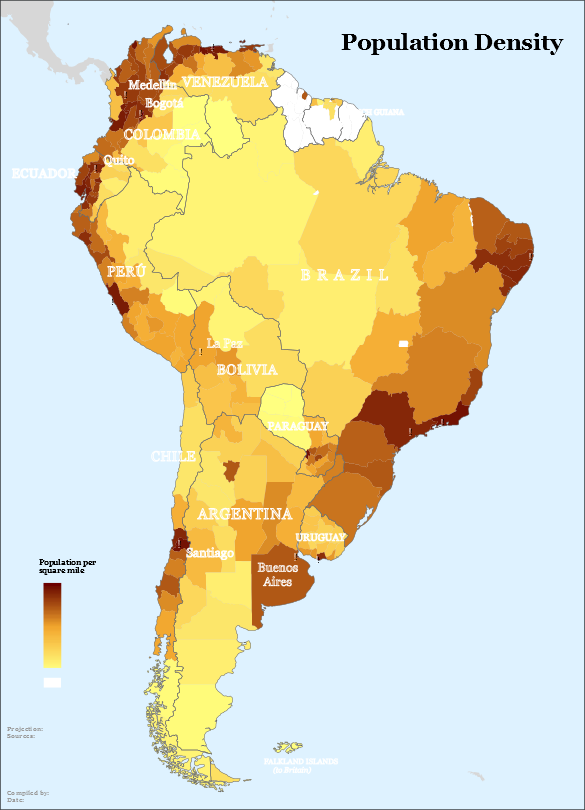
South American population
An exercise using a choropleth map to depict population density, using a fixed population data set. The sub-state units in this data set varied dramatically in size, thus creating an uneven picture of density.
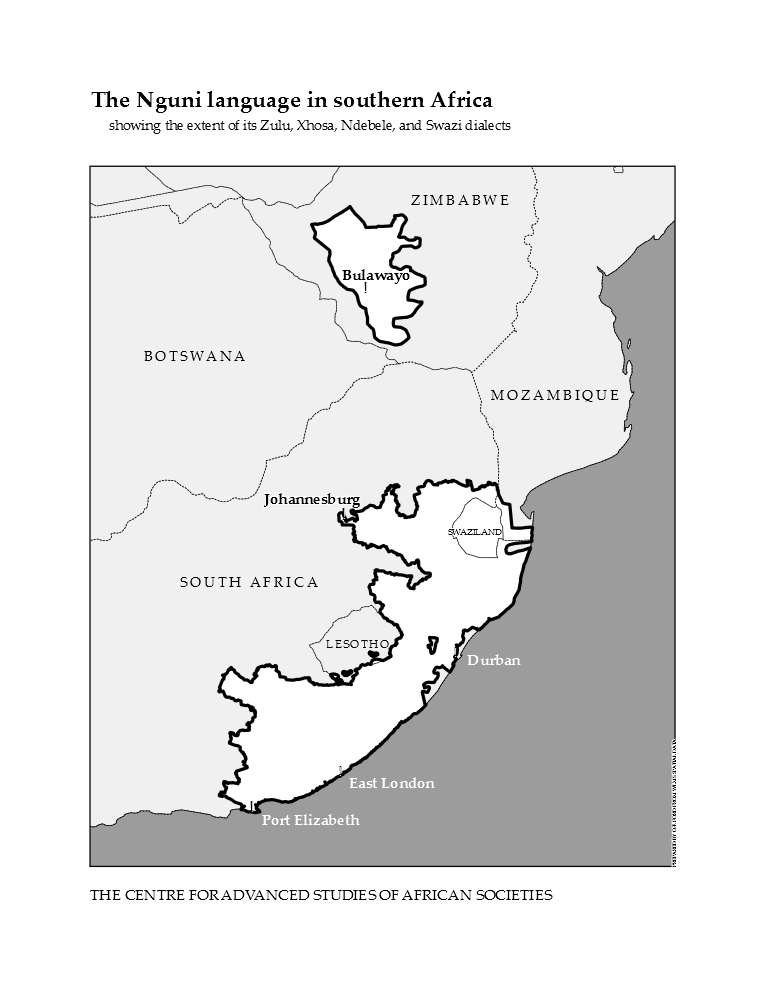
The Nguni language in southern Africa
Proof of concept to illustrate mutual intelligibility. The conventional depiction of Sub-Saharan Africa linguistically is much more fragmented than mutual intelligibility would suggest. Zulu, Xhosa, Ndebele, and Swazi are treated as separate languages, but by the usual linguistic standard are dialects of a single language.
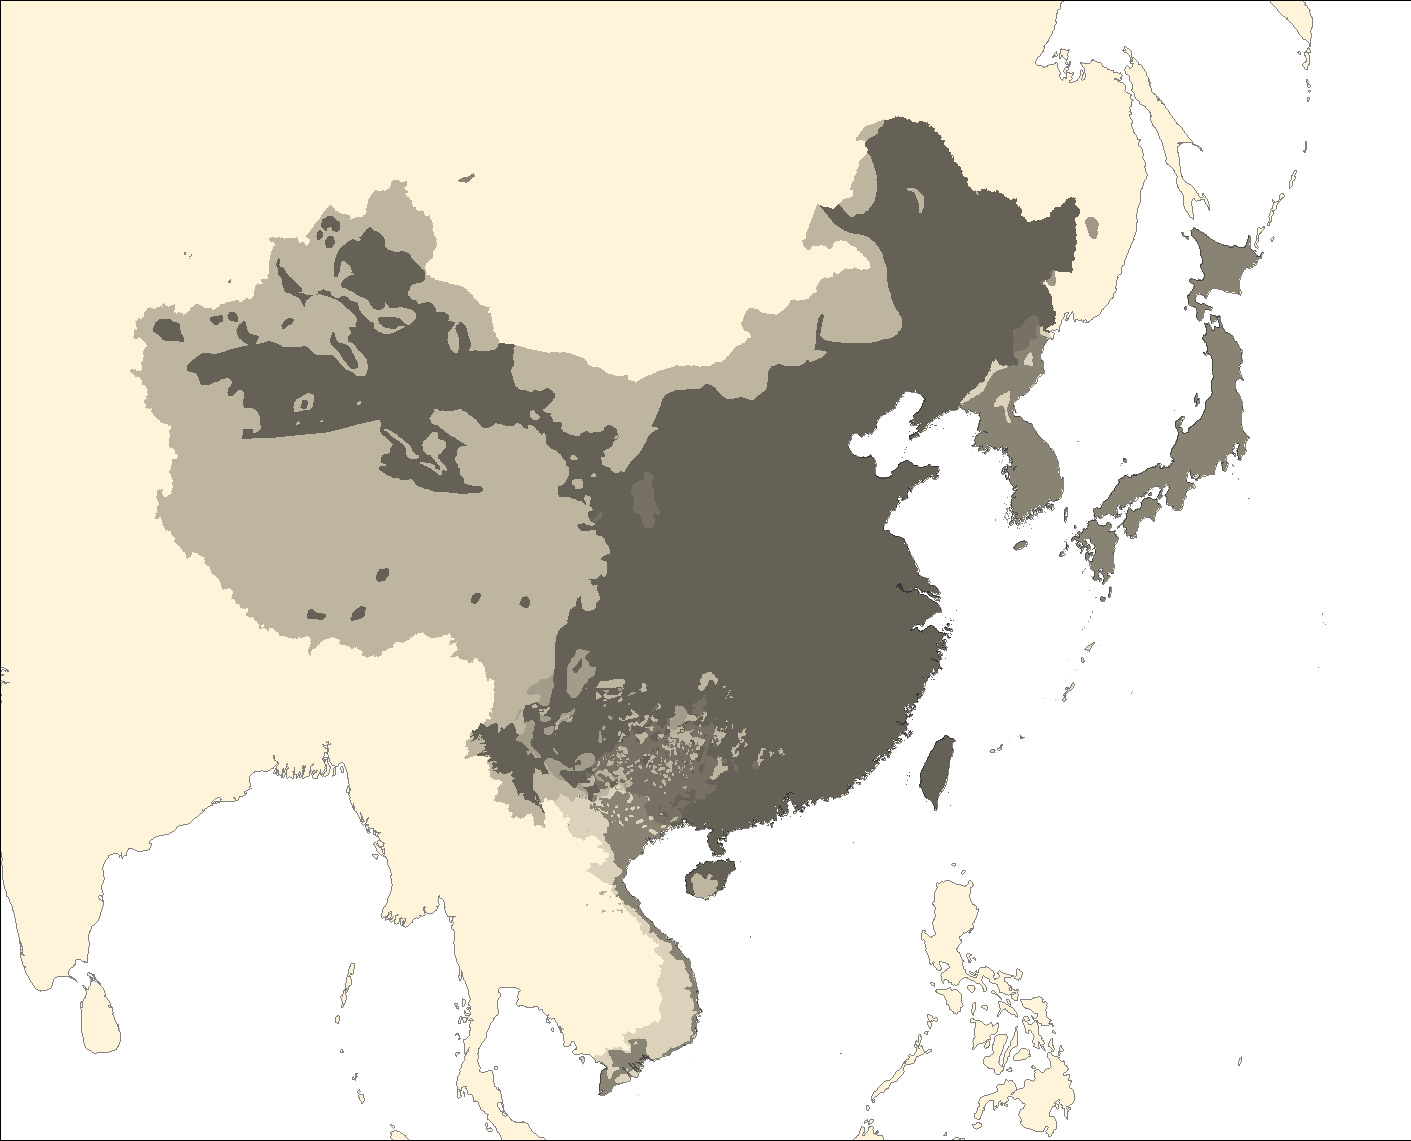
Sino-Asia
This is the superregional depiction of Sino-Asia, the cultural region in East Asia determined by Chinese cultural influence. Darker areas share greater Chinese influence. Note that portions of the Peoples Republic of China are less influenced by Chinese culture than Korea, Japan, and parts of the Vietnamese state.
|
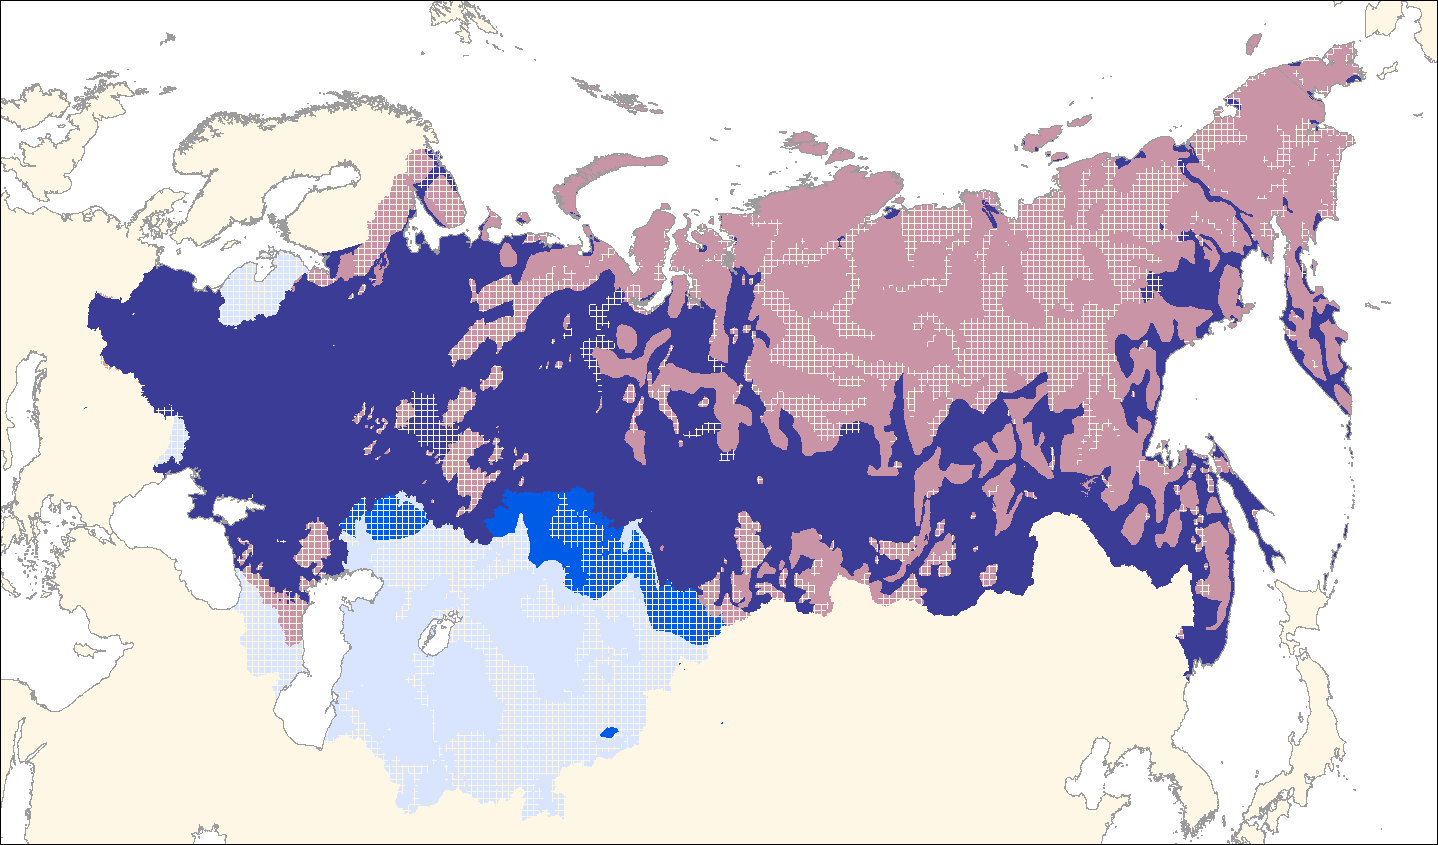
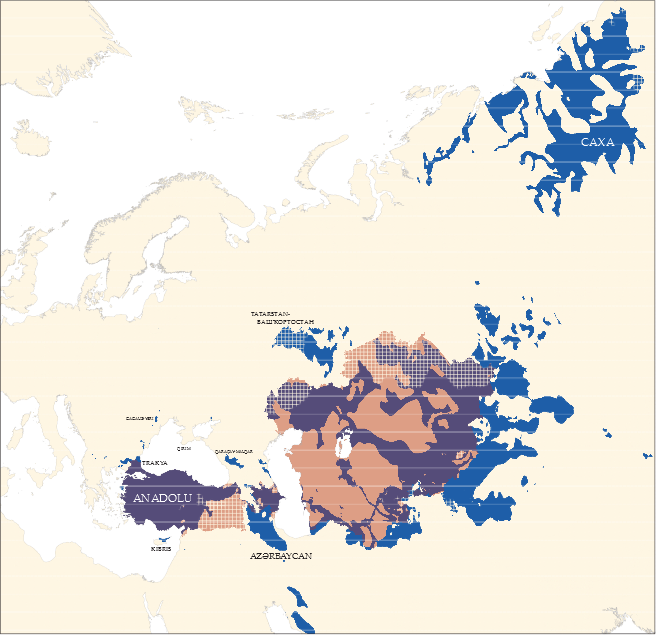
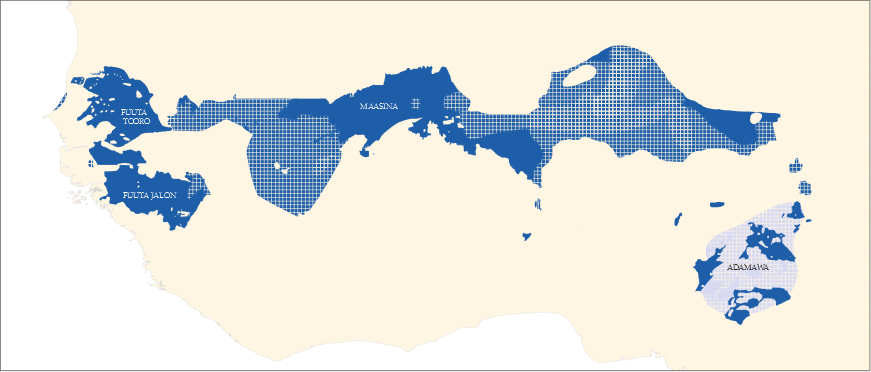
Language maps
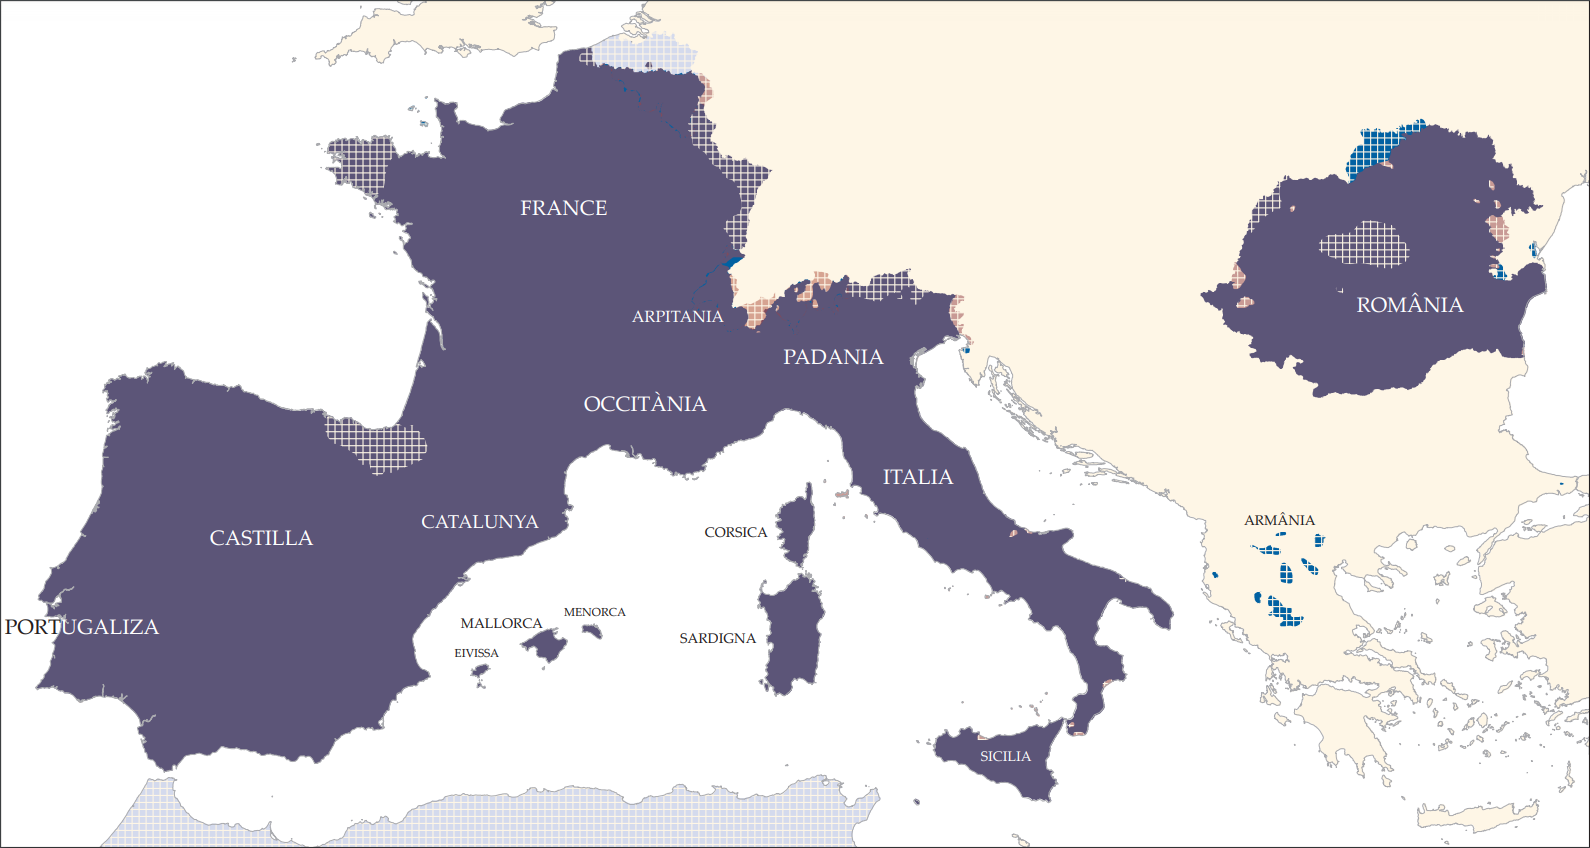
In my main series of language maps, royal blue marks areas of native use, red marks areas of government sponsorship, and the purple shows the overlap of the two. Light blue is for use as a lingua franca, and hatching marks competing native dialects. Below, representative maps, showing the North Slavic dialect continuum, the Turkic continuum, the Fulani region, and the Romance regions of Europe. One purpose of such maps is to allow the visualization of real language regions, as opposed to country-based depictions. A second purpose is to visualize linguistic regions as complex, depending on various factors, rather than as single, uniform areas bounded neatly with a line.
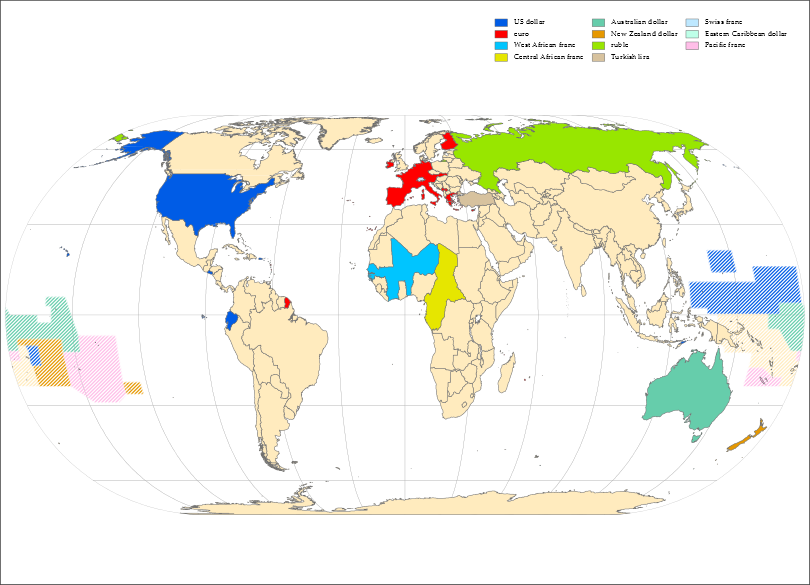
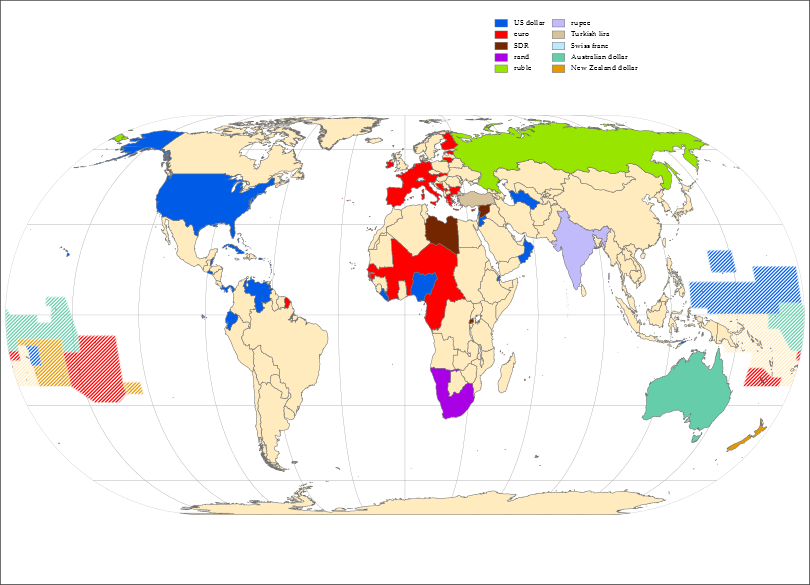
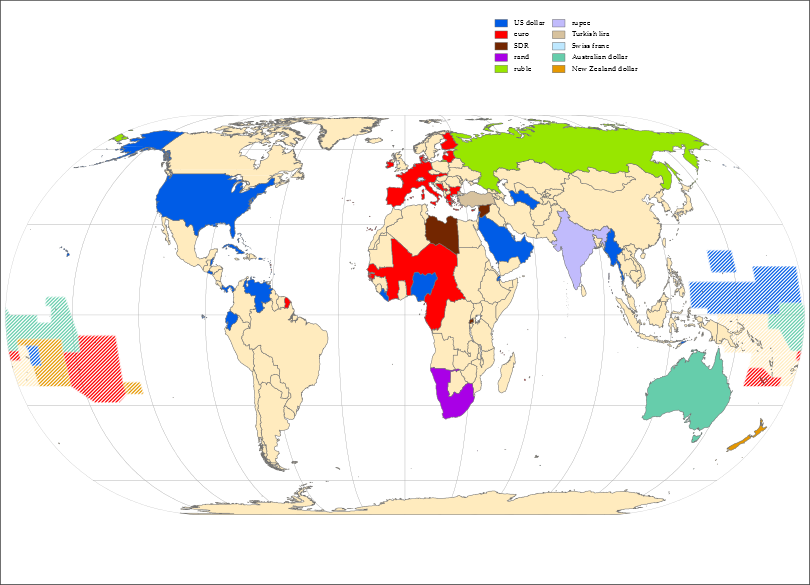
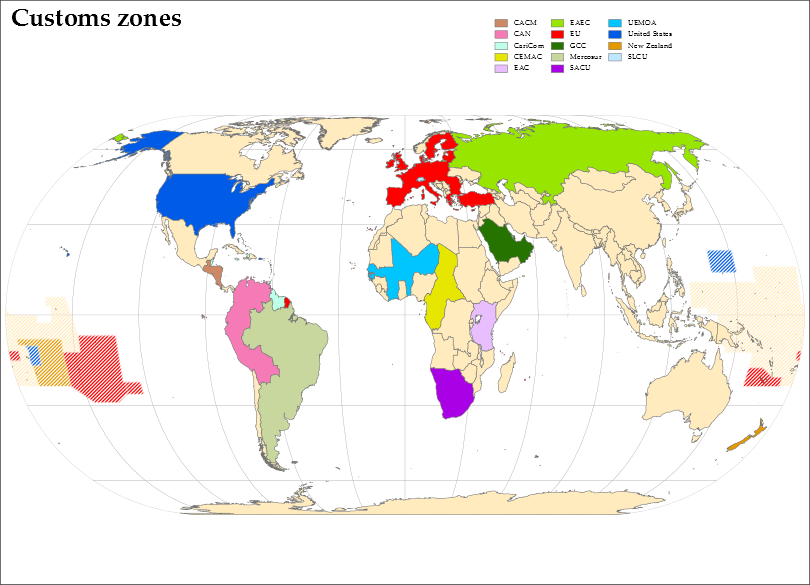
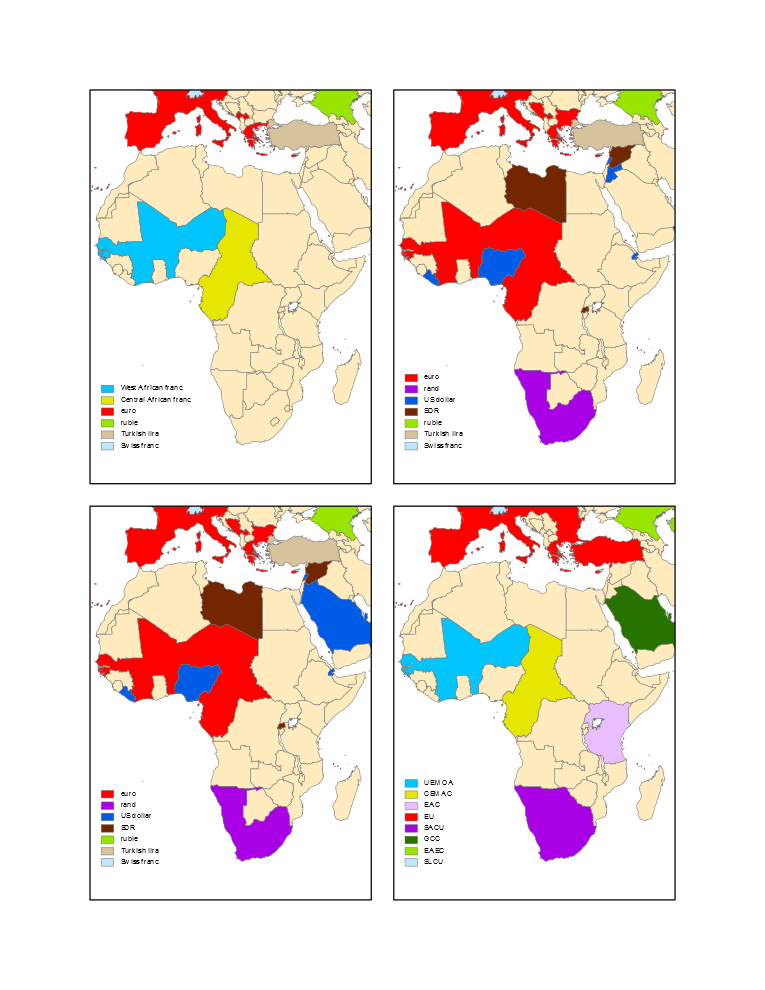
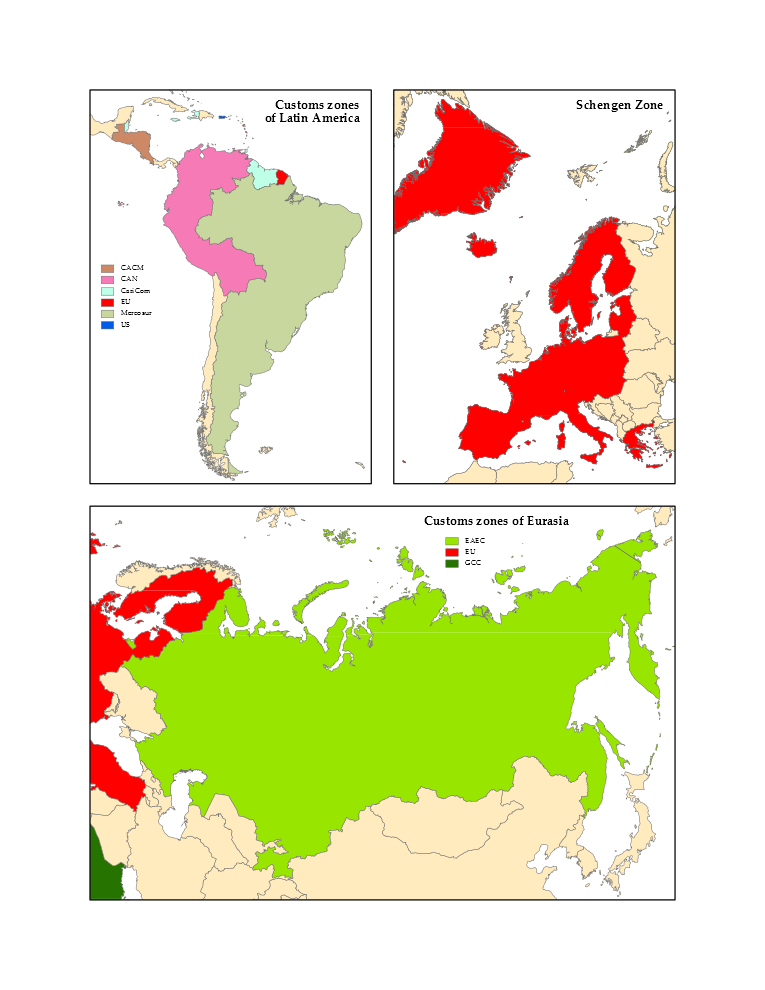
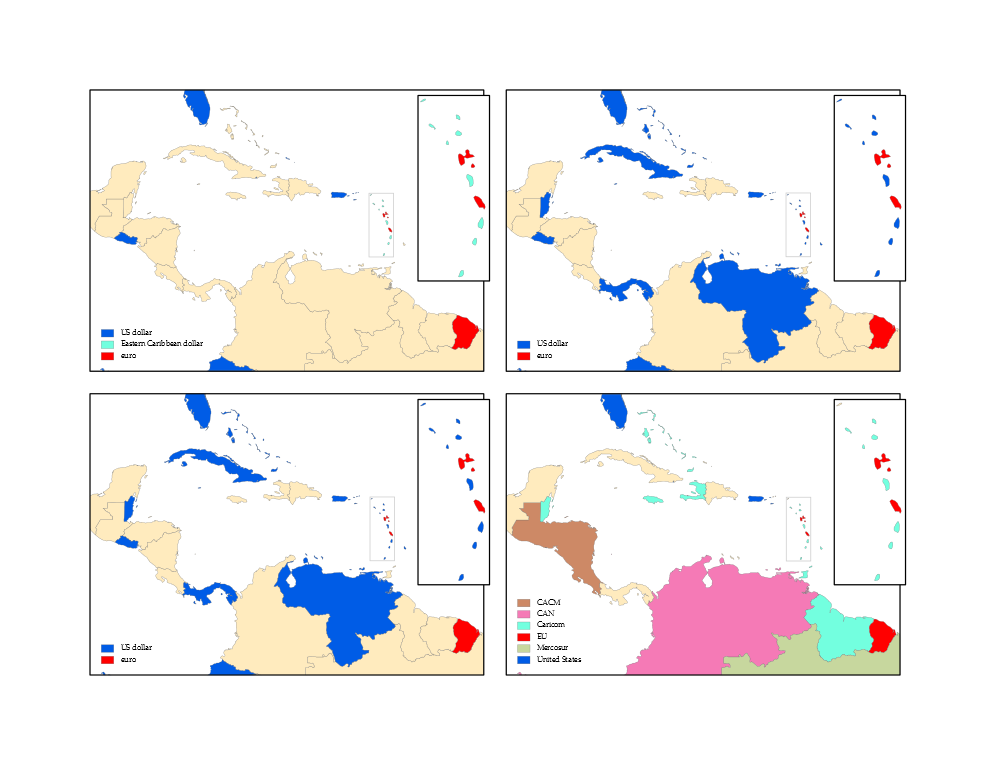
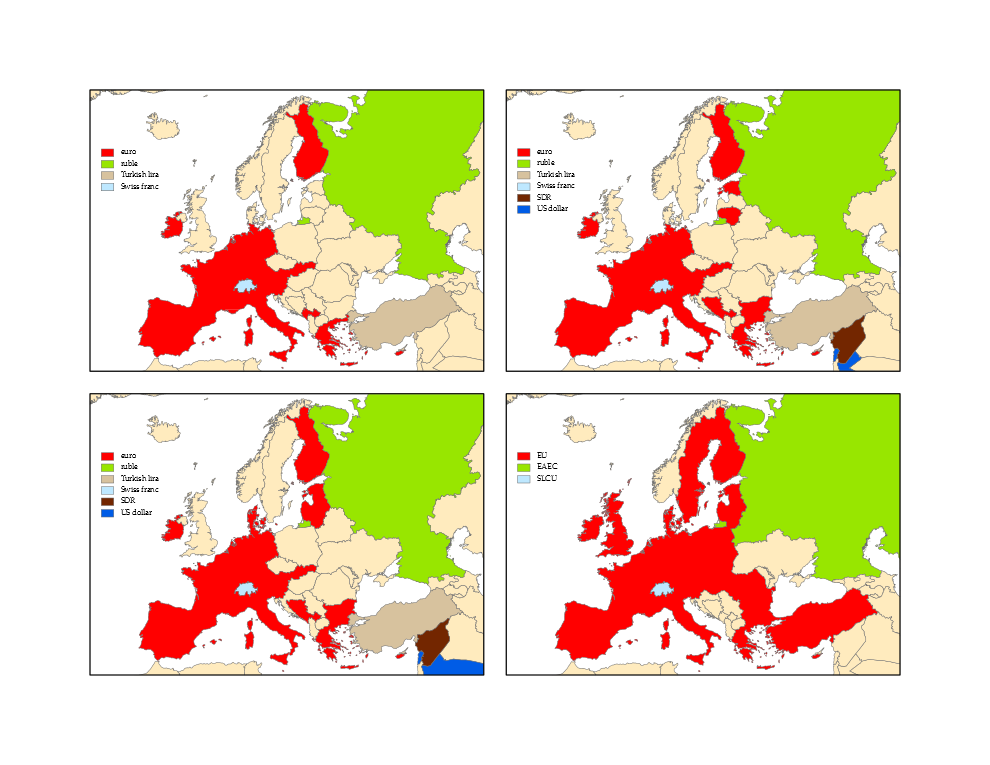
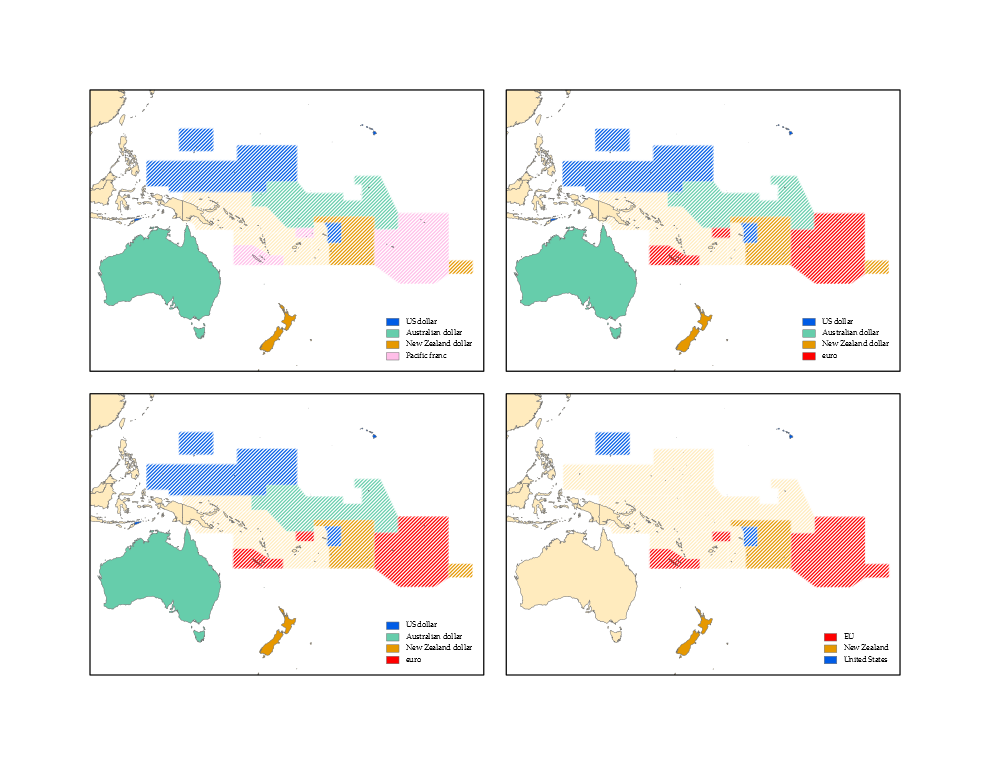
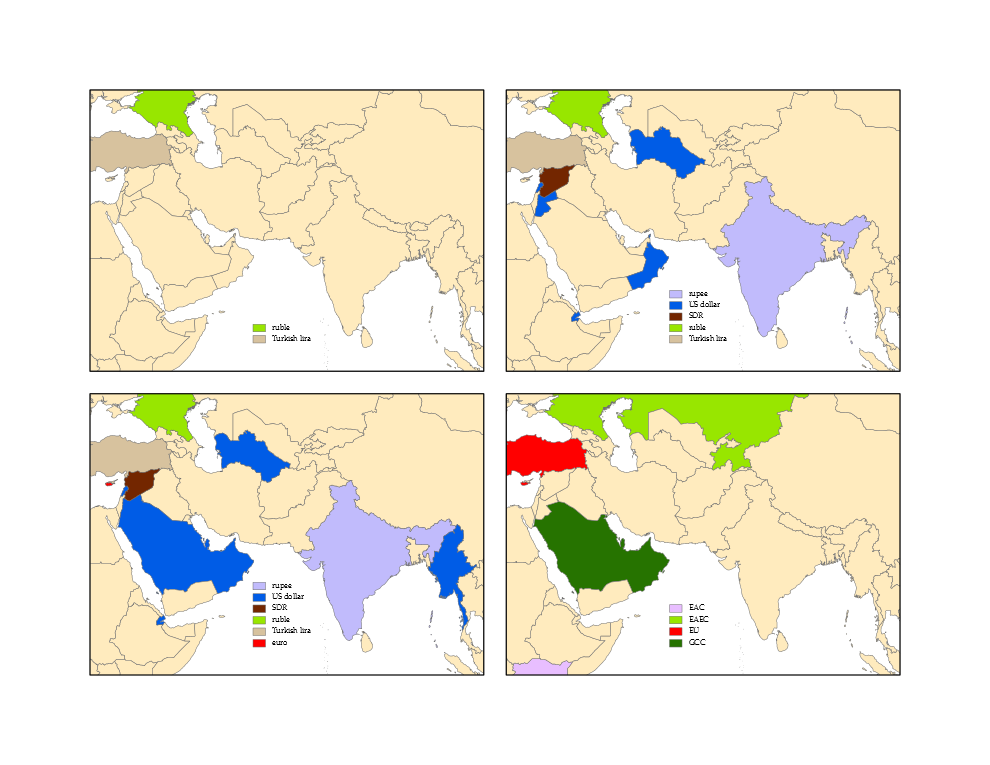
Currency and trade bloc study, 2007
An examination of economic deviations from the country model. In each map, the country model is shown in cream, while other colors are used for deviations. Thus, the more of the map in alternate colors, the more of the world that deviates from the country model. Currencies are considered at three levels: (1) maximal, counting the number of circulating currencies; (2) medial, counting the number of currency values; (3) minimal, counting the number of independent currencies. Even at the maximal level, there are far fewer currencies than countries. There are even fewer currency values, as some states peg their currencies values directly to another currency. At the minimal level, there are fewer independent currencies, since additional states link their currencies values to another currency through a narrow range. In addition to the currency zones, this study looked at customs unions, in which several states share a common external tariff (and no internal tariffs), and therefore function as a single region for many trading purposes. The entire study thus divided the world four times maximal, medial, and minimal currency zones, and customs zones. The maps series include larger-scale maps of regions of the world for detail, using the same four data series.
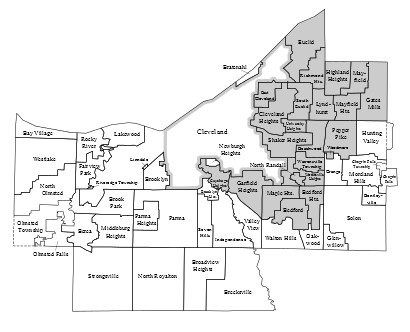
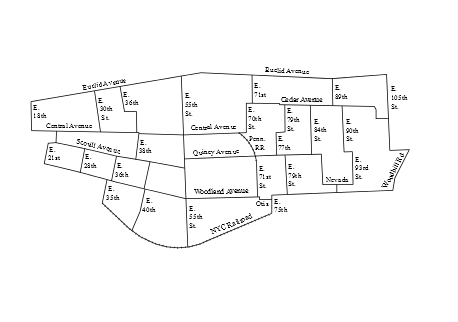
Cleveland communities and Cleveland streets
A commission for Bessie House-Soremekun, Confronting the odds: African American entrepreneurship in Cleveland, Ohio, Kent State University, 2009. The maps needed to match those used in a previous edition: a simple map of Cleveland-area municipalities (with shading to indicate the area of focus), and a simplified map of specific streets in the Central neighborhood.
© O.T. FORD
|
THE STEWARDSHIP
Home of the Stewardship Project
and O.T. Ford
|
